Homeless Encampments and Deaths
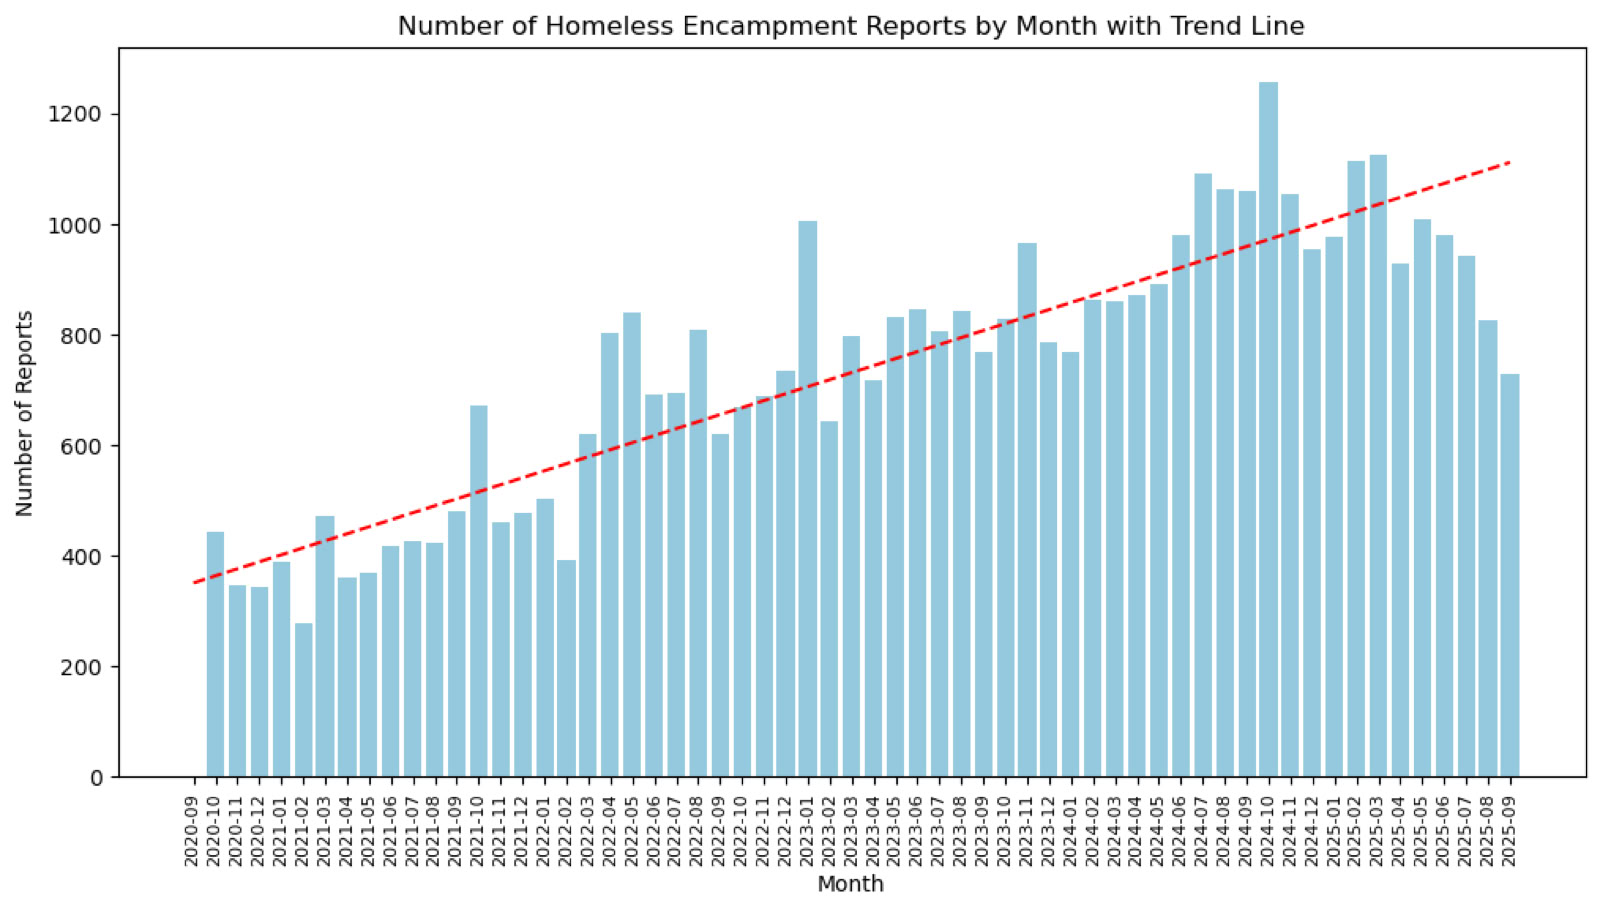
Despite the deficiencies, both the police incident data, and the 311 call data, contain geographic coordinates. This makes it possible to quantify proximity and frequency which can be used for map-based visualizations. According to the Dallas 311 data, there were 44,545 calls concerning homeless encampments between October 1, 2020 and September 30, 2025. Since the calls include geolocations, a heat map can be used to compare areas with lesser number of calls to areas garnering a greater number of 311 calls.
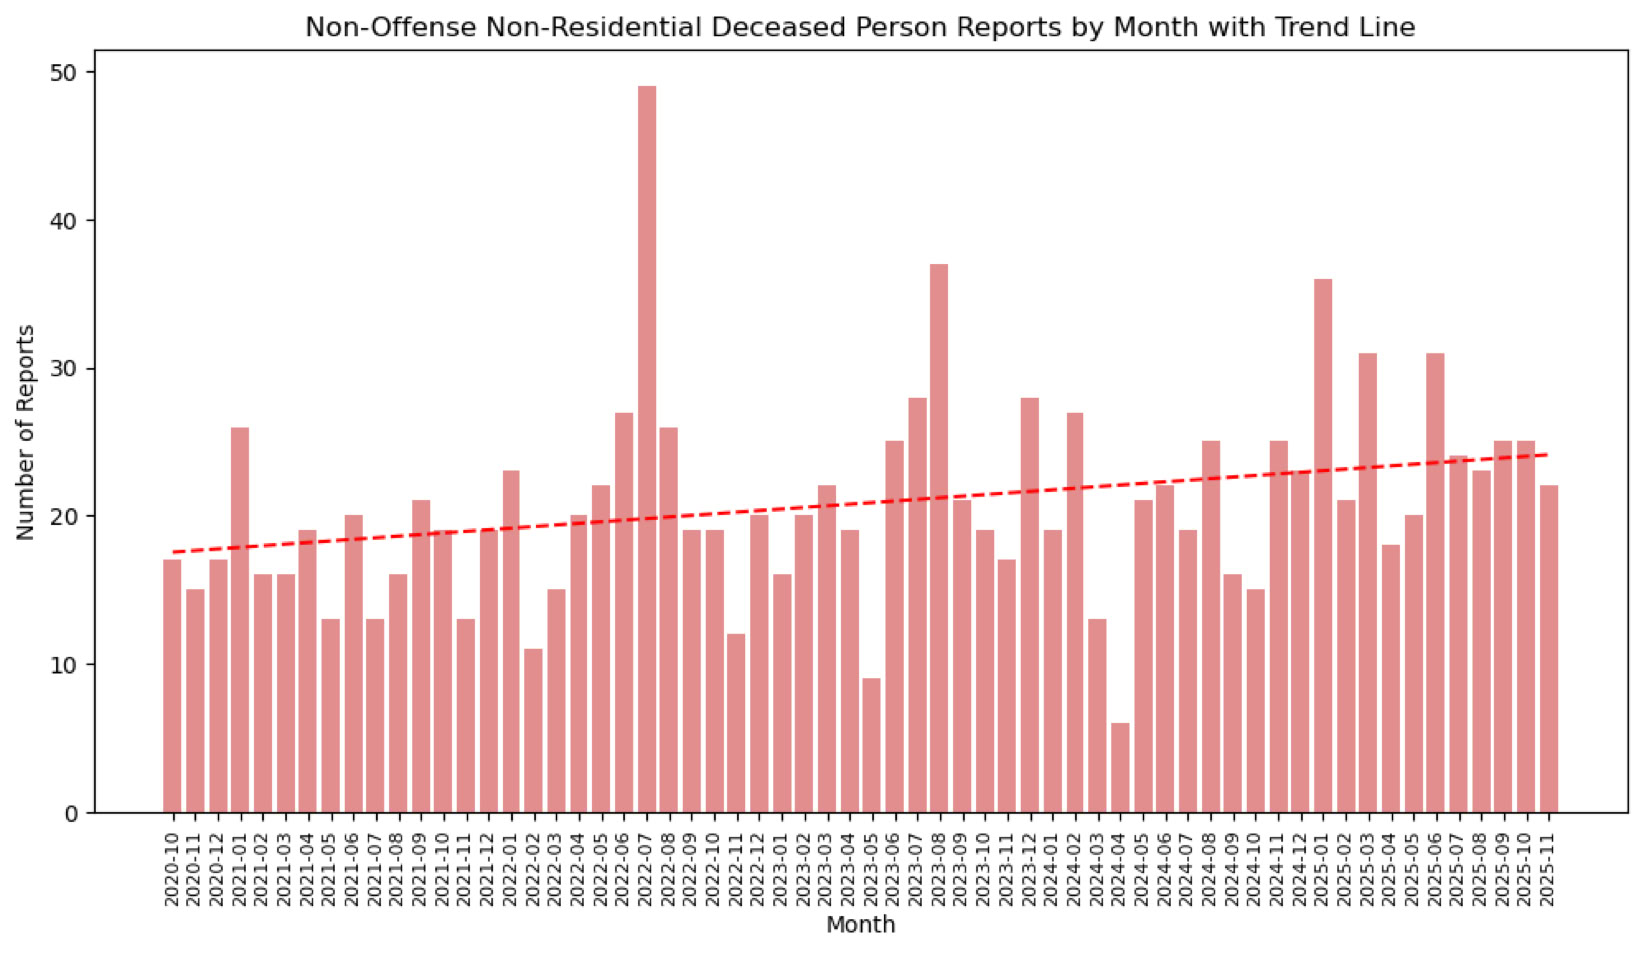
An exploration of the Dallas Police incident data, reveals three types of “No offense” death incident categories. These include police calls determined to be non-homicidal in nature. The categories are: "accidental death", "unexplained death", and "natural death". Many of these non-offense deaths occurred in residential settings (houses, apartments, hospitals, hotels/motels and so forth). Other non-offense deaths were recorded as occurring in other than residential locations including:
- Highway, Street, Alley ETC
- Outdoor Area Public/Private
- Parking (Business)
- Field/Woods
- Single Family Residence - Vacant
- Commercial Property Occupied/Vacant
- Lake/Waterway/Beach
- Apartment Parking Lot
- Gas or Service Station
- Parking Lot (All Others)
- Abandoned/Condemned Structure
- Convenience Store
- Other
A search of the data since October 1, 2020 yielded over 1,200 observations of non-offense deaths in these categories. A map of these can likewise be constructed based on the geographic coordinates included in the incident data.
Since the homeless encampment calls-for-service can be visualized as a heat map, these non-offense deaths can be added and a composite map constructed. This allows for visual inspection of correlations if any. It is worthy to note that this data only includes City of Dallas data and excludes other municipalities that border the city (e.g. University Park, Highland Park, Richardson and so forth).
To reiterate: all data used in these visualizations are produced and maintained by the City of Dallas. City data is simply placed on maps.